


Unlock the dynamic world of interactive and animated data visualization with this all-in-one guide tailored for students, researchers, data scientists, and R enthusiasts. Comprehensive Guide to Data Visualization with gganimate & Shiny in R blends the aesthetic power of the gganimate package with the interactivity of Shiny to help you create compelling, story-driven, and responsive visualizations.
This book walks you through the entire process of creating stunning animated plots and interactive web applications using R. Starting from the fundamentals of data visualization with ggplot2, it gradually builds up to advanced topics, including animation techniques, reactivity in Shiny, custom CSS styling, and real-world project deployment.
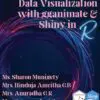
Comprehensive Guide to Data Visualization with gganimate & Shiny in R
Estimated delivery dates: Jun 15, 2026 - Jun 19, 2026
₹659.00 Save:₹40.00(6%)
"Data tells a story, but animation gives it a heartbeat. With gganimate in R, you transform static insights into living narratives that move with time and meaning."
Ms. Sharon Munigety, B.E., M.Tech, (Ph.D.)
"Shiny doesn't just display your data it invites users to explore, interact, and uncover insights for themselves. When paired with ggplot2 and gganimate, the result is truly immersive analytics."
Mrs.Hinduja Amritha C.B, (Ph.D.)
"A well-crafted animated visualization doesn't just inform - it captivates. Using gġanimate, you guide your audience through the data like a storyteller guides through a tale."
Mrs. Anuradha G R, MCA, (Ph.D)
"Combining ggplot2, gganimate, and Shiny is like adding voice, motion, and interaction to your data. It's the evolution of visualization – from charts to conversations."
Mrs. Saranya devi S, M.E(CSE)
Description
Additional Information
| Weight | 0.65 kg |
|---|---|
| Dimensions | 27.87 × 21.6 × 4.2 cm |
| Binding Type | Paperback |
| Languages | |
| Publishers |
Reviews
Only logged in customers who have purchased this product may leave a review.


Reviews
There are no reviews yet.